Start from decisions, not charts
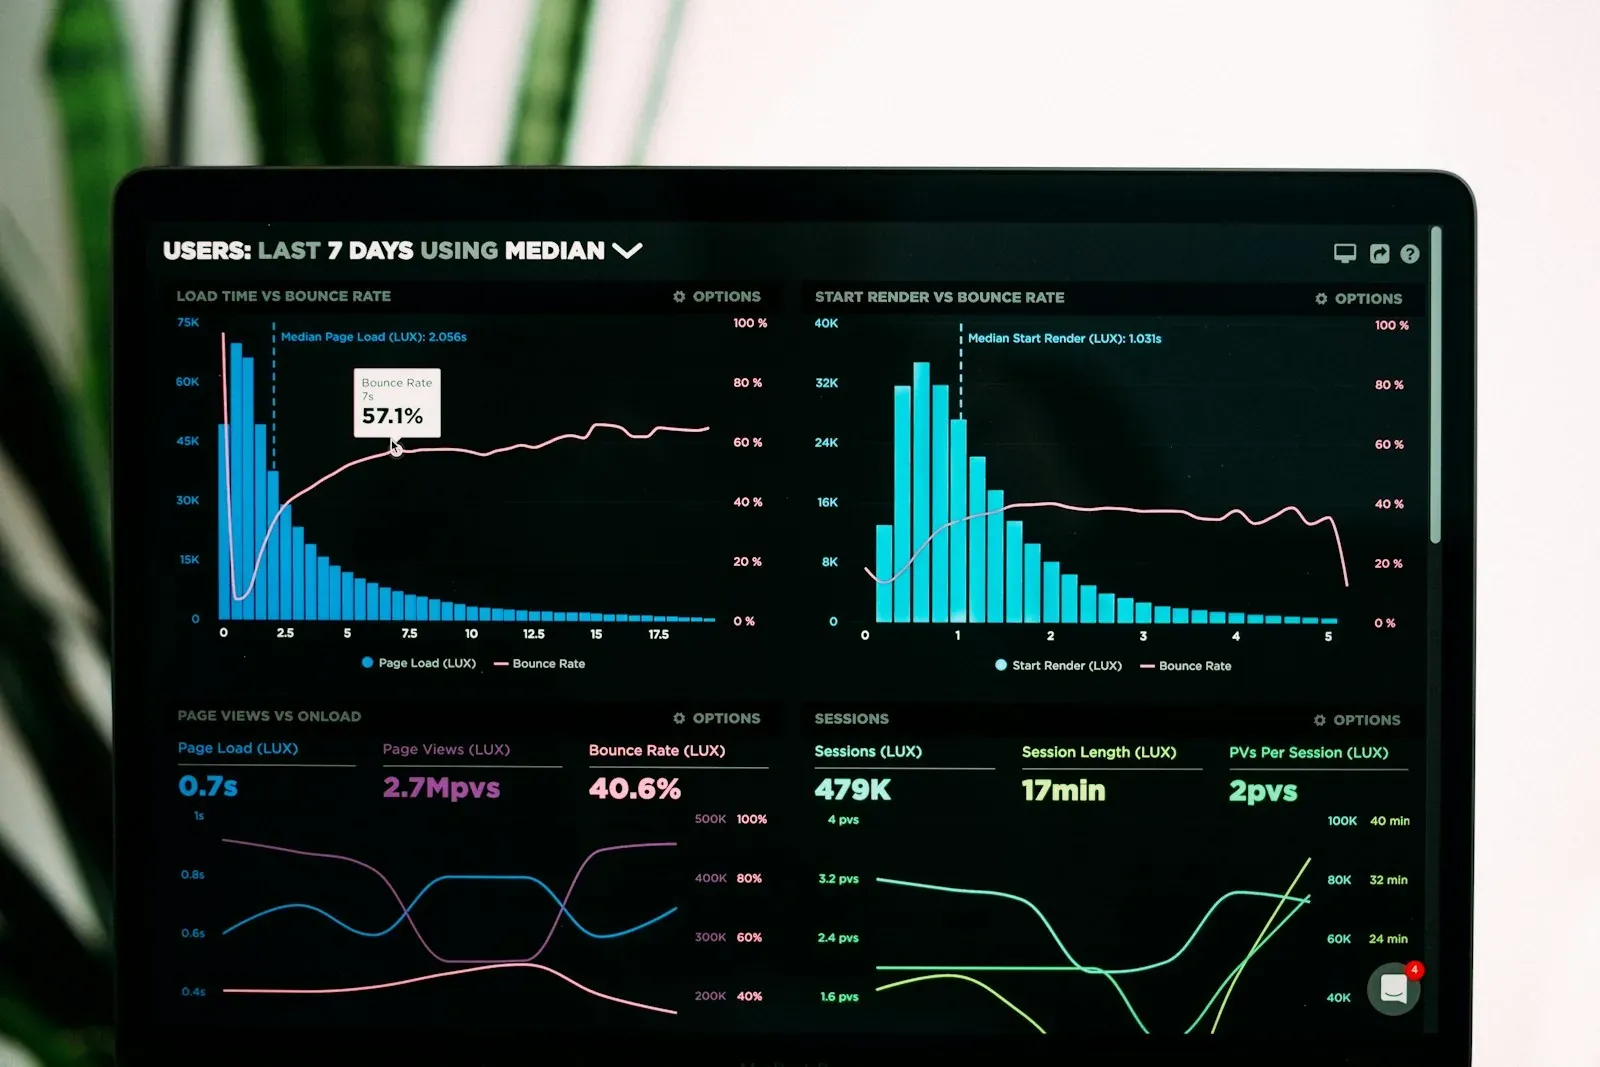
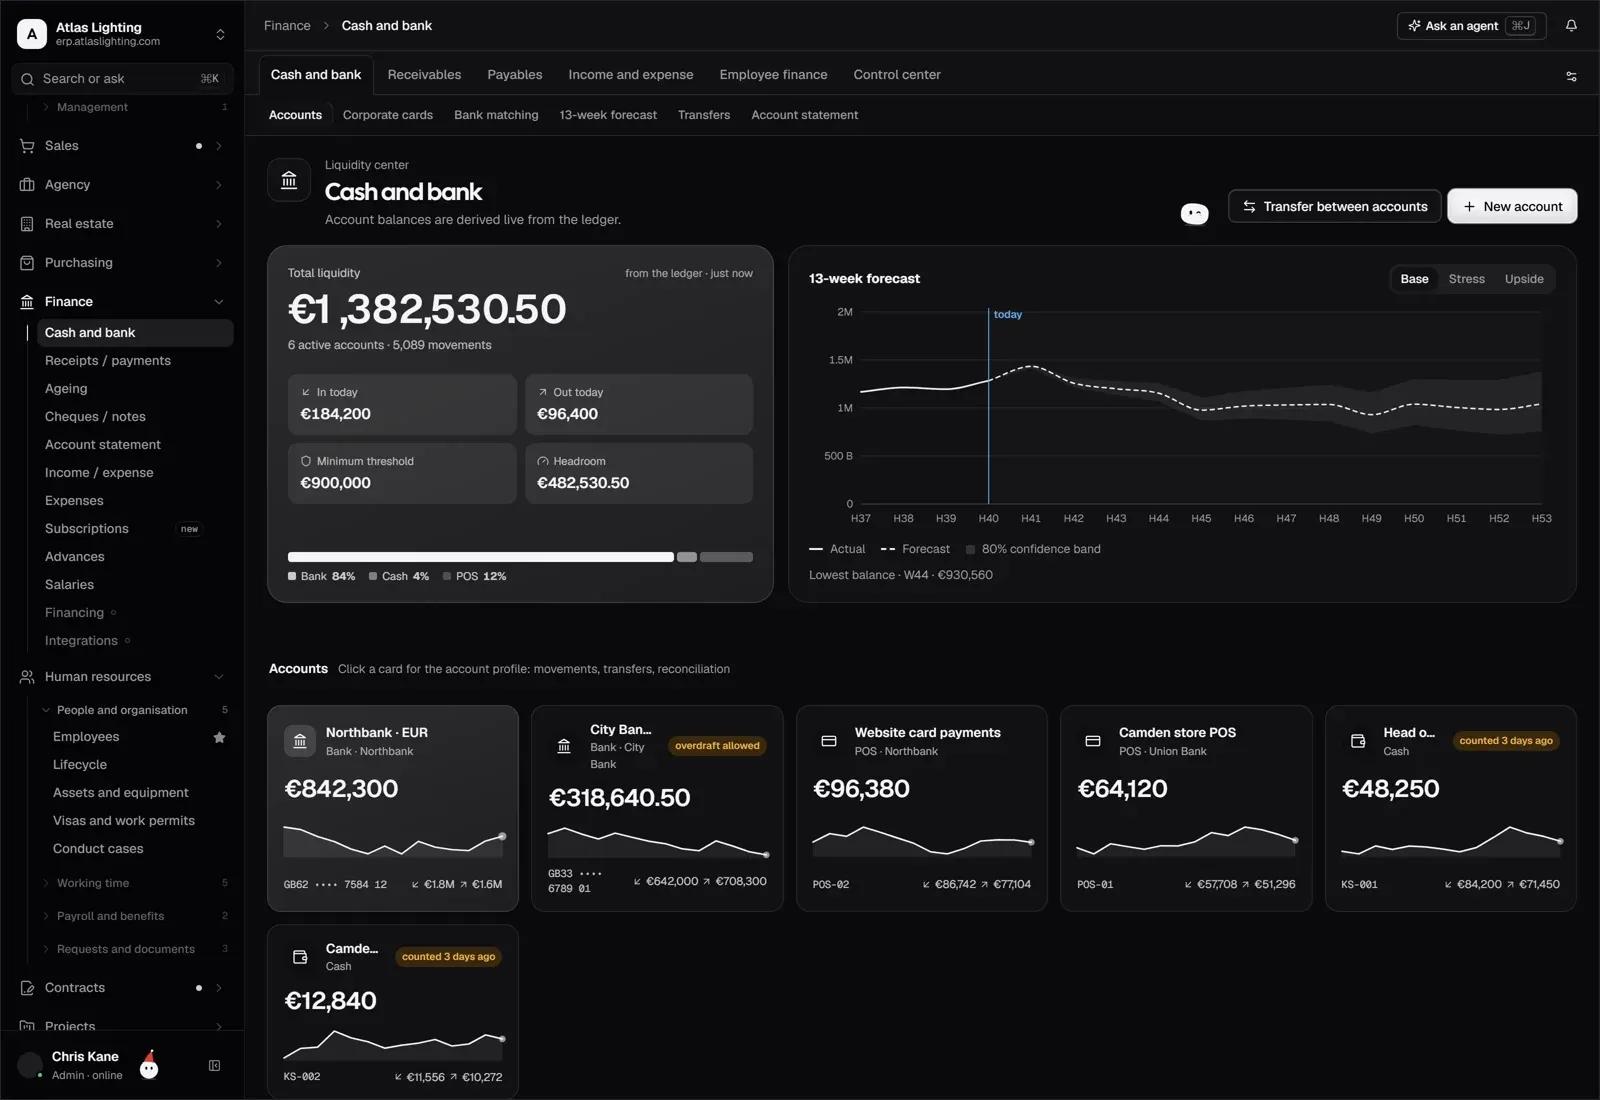
A useful dashboard answers a question someone actually has to decide on. We begin by listing those decisions, who makes them and how often, then design the data and views that support them.
This keeps the platform small and trusted, instead of a large set of charts that nobody opens.
Do you need a data warehouse?
Not always. Smaller organisations can report well from a clean operational database with a few prepared views. A warehouse becomes worthwhile when you combine many sources, keep long history, or serve many teams with different questions.
We recommend the simplest architecture that will still hold up as data and teams grow.
One definition per metric
Conflicting numbers usually come from different definitions, not wrong data. We agree how each key metric is calculated, from which source and who owns it, and we keep that definition in one place that every report uses.
From dashboard to action
Insight only helps if it reaches the people who can act. Alerts, scheduled reports and figures embedded in operational screens close the gap between noticing a problem and doing something about it.